Writing the Research Report
A Guide to APA Style Scientific Writing
Introduction: The Research Report as Communication
A research report is not just a record of what you did – it is a persuasive argument that your research question is important, your methods are sound, your results are reliable, and your conclusions are justified. Writing a good report requires clarity, precision, and adherence to conventions (APA 7th edition style).
This guide provides detailed, practical advice for writing each section of your report, with specific attention to common mistakes, examples of good and bad writing, and how to use AI tools ethically to improve your work.
ImportantThe Purpose of Scientific Writing
The goal of scientific writing is to:
- Communicate clearly: Use simple, direct language
- Report accurately: Represent your findings honestly, including negative results
- Enable replication: Provide enough detail that others could repeat your study
- Contribute to knowledge: Situate your work within existing theory and literature
The Hourglass Model
The structure of a research report follows an hourglass shape:
- Wide at the top (Introduction): Start with broad context, narrow to your specific question
- Narrow in the middle (Method & Results): Specific details of what you did and found
- Wide at the bottom (Discussion): Broaden back out to general implications and future directions
Why this structure?
- Readers need context before they care about your specific study
- Methods and results require precision and detail
- Discussion connects your specific findings back to the broader literature
Overall Structure and Length
A full empirical report for PSY3009F should be <30 pages (1.5 line-spaced, excluding references and appendices) and include:
- Title Page (1 page)
- Abstract (1 page, <250 words)
- Introduction/Literature Review (4-6 pages)
- Method (3-5 pages)
- Results (3-5 pages)
- Discussion (4-6 pages)
- References (3-5 pages typically)
- Appendices (if needed: measures, ethics approval)
TipWriting Order
Do not write in the order the sections appear in the final report. Use this order instead:
- Method (easiest; just describe what you did)
- Results (describe what you found)
- Introduction (you need results to know what to emphasise)
- Discussion (interpret results in light of introduction)
- Abstract (summarise everything)
- Title (capture the essence of the whole paper)
Section 1: Title Page
What to Include
- Full title: Concise but informative (10-15 words)
- Authors: All group members’ names
- Institutional affiliation: University of Cape Town, Department of Psychology
- Course information: PSY3009F, 2026
- Word count: Exclude references and appendices
Writing a Good Title
A good title:
- Identifies the variables: Mention the IV and DV
- Is specific: Not “A Study of Memory” but “The Effect of Emotional Valence on Recognition Memory for Words”
- Avoids jargon: Write for an educated reader, not just specialists
- Is concise: Aim for 10-15 words
Examples
❌ Weak titles:
- “Memory” (too vague)
- “An Experimental Investigation into the Potential Effects of Self-Referential Encoding Strategies on Subsequent Recognition Memory Performance” (too long)
- “Does Emotion Affect Memory?” (too informal, not specific enough)
✅ Strong titles:
- “The Self-Reference Effect: Enhanced Recognition Memory for Self-Associated Objects”
- “Own-Race Bias in Face Recognition: Evidence from South African University Students”
- “Weapon Focus Effect on Eyewitness Memory: A Replication with Simulated Crime Scenarios”
Section 2: Abstract
Purpose
The abstract is a standalone summary of your entire study. Many readers will only read the abstract, so it must be complete and informative.
Structure (4 Sentences, ~250 Words)
- Background & Aim (1-2 sentences): What is the problem? What was your research question?
- Method (2-3 sentences): Who were participants? What did you do? What measures?
- Results (2-3 sentences): What did you find? Report key statistics.
- Conclusion (1-2 sentences): What do the findings mean? What are the implications?
Example Abstract
NoteExample: Strong Abstract
Background: The own-race bias (ORB) refers to the phenomenon whereby people recognise faces of their own race more accurately than faces of other races. While ORB has been extensively documented in Western populations, less research has examined whether it occurs in diverse South African contexts. Aim: This study investigated whether South African university students show ORB in a recognition memory task, and whether the magnitude of the effect differs by participant race. Method: Black (n = 42) and White (n = 38) participants completed a face recognition task involving 30 Black and 30 White faces. Participants first studied faces for 3 seconds each, then completed a recognition test with 60 old faces and 60 new faces. Recognition accuracy (d’) was calculated for own-race and other-race faces. Results: A 2 (Participant Race) × 2 (Face Race) mixed ANOVA revealed a significant interaction, F(1, 78) = 15.23, p < .001, \(\eta_p^2\) = .16. Both Black and White participants showed higher d’ for own-race faces (Black: M = 1.82, SD = 0.45; White: M = 1.79, SD = 0.52) compared to other-race faces (Black: M = 1.23, SD = 0.38; White: M = 1.31, SD = 0.41). Conclusion: The findings confirm that ORB occurs in both Black and White South African students, with medium-to-large effect sizes. This suggests that ORB is a robust cross-cultural phenomenon and supports perceptual expertise and social categorisation accounts of the effect.
Common Mistakes
❌ Too vague: “This study investigated memory. Participants completed a memory task. The results were significant. This has important implications.”
❌ Missing statistics: “The results showed that participants remembered more self-related items.” (How much more? What was the p-value?)
❌ Not standalone: “As discussed in the Introduction…” (The abstract should not reference other sections)
✅ Solution: Be specific, include key statistics, make the abstract self-contained.
Section 3: Introduction/Literature Review
Purpose
The Introduction also known as the literature review answers three questions:
- Why is this research important? (Broad context)
- What do we already know? (Literature review)
- What is your contribution? (Research gap, hypothesis)
Structure: The Funnel
The Introduction follows a funnel structure: start broad, narrow progressively to your specific hypothesis.
Paragraph 1: The Hook (Broad Context)
Start with a compelling, broad statement that explains why the topic matters.
NoteExample Opening Paragraph
Every day, people rely on their memory to recognise faces – from identifying colleagues at work to picking out a suspect in a police lineup. However, face recognition is far from perfect. One of the most robust findings in the face recognition literature is the own-race bias (ORB): people are better at recognising faces of their own race compared to faces of other races (Meissner & Brigham, 2001). This bias has important real-world implications, particularly in the criminal justice system, where eyewitness misidentifications disproportionately affect individuals from racial minorities (Scheck, Neufeld, & Dwyer, 2000). Understanding the mechanisms underlying ORB is therefore critical for both theoretical and applied reasons.
Why this works:
- ✅ Starts with a relatable, real-world context
- ✅ Introduces the key phenomenon (ORB)
- ✅ Explains why it matters (criminal justice implications)
Paragraphs 2-4: Theoretical Background
Introduce the theories and key findings relevant to your study. Organise by themes, not by individual studies.
Common Mistake: The “Shopping List” Literature Review
❌ Weak:
Smith (2010) found that people remember emotional words better than neutral words. Jones (2012) also found that emotional words are remembered better. Brown (2015) investigated memory for emotional words and found similar results. Wilson (2018) replicated this finding.
This is a list, not a synthesis. It does not explain why emotional words are better remembered or what remains unknown.
Better Approach: Thematic Synthesis
✅ Strong:
A substantial body of evidence demonstrates that emotional stimuli are better remembered than neutral stimuli, a phenomenon known as the emotional enhancement effect (Kensinger & Corkin, 2003; LaBar & Cabeza, 2006). Two primary mechanisms have been proposed to explain this effect. First, the arousal hypothesis suggests that emotional stimuli activate the amygdala, which modulates hippocampal consolidation and strengthens memory encoding (McGaugh, 2004). Supporting this view, neuroimaging studies show increased amygdala activation during encoding of emotional (vs. neutral) stimuli, and this activation predicts subsequent memory performance (Cahill et al., 1996). Second, the distinctiveness hypothesis proposes that emotional stimuli are better remembered because they are more distinctive and attention-grabbing, leading to deeper processing (Talmi et al., 2007). However, research has shown that emotional enhancement persists even when arousal is controlled, suggesting that arousal alone cannot fully explain the effect (Kensinger & Corkin, 2004). This indicates that multiple mechanisms may contribute to emotional memory enhancement.
Why this is better:
- ✅ Organised by theories (arousal vs. distinctiveness), not by authors
- ✅ Cites multiple studies to support each claim
- ✅ Identifies a complexity or debate in the literature
Paragraphs 5-6: Research Gap
Identify what is not yet known or inconsistent in the literature. This is the space your study will fill.
NoteExample Research Gap
While ORB has been extensively documented in Western populations (primarily in the US and Europe), less research has examined ORB in diverse, post-apartheid South African contexts. South Africa is characterised by high levels of interracial contact, which some researchers have argued should reduce ORB by increasing perceptual expertise with other-race faces (Chiroro & Valentine, 1995). However, other researchers have found that social categorisation processes (rather than mere perceptual experience) drive ORB (Levin, 2000), suggesting that ORB may persist even in diverse contexts. To date, only two studies have examined ORB in South African samples (Chiroro & Valentine, 1995; Wright et al., 2001), and both reported conflicting results. Therefore, further research is needed to clarify whether ORB occurs in South African university students, who are likely to have high levels of interracial contact.
Final Paragraph: The Current Study and Hypothesis
State your research question, design, and hypothesis.
NoteExample Final Paragraph
The current study investigated whether South African university students demonstrate ORB in a face recognition task. We hypothesised that both Black and White participants would show higher recognition accuracy (d’) for own-race faces compared to other-race faces, consistent with previous findings in Western populations. A significant interaction between participant race and face race would provide evidence that ORB occurs in South African contexts despite high levels of interracial contact.
Key elements:
- ✅ States the aim (what we tested)
- ✅ States the hypothesis (what we predicted)
- ✅ States the key analysis (what would count as evidence)
How AI Can Help (and Harm) Your Introduction
✅ Good Uses of AI
- Brainstorm structure: “I am writing an Introduction about the own-race bias. Suggest a logical structure for presenting the theories and findings.”
- Check logical flow: “Here is my draft Introduction [paste text]. Does the argument flow logically from general to specific? Are there any logical gaps?”
- Find gaps: “Based on this literature review, what research questions remain unanswered?”
❌ Bad Uses of AI
- Asking AI to write it: “Write an Introduction about the own-race bias.” (This is plagiarism, even if you edit it)
- Trusting AI citations: AI often hallucinates citations – cites papers that do not exist or misrepresents findings. Always verify citations by reading the actual paper.
WarningAI Hallucination Example
Prompt: “Find three recent studies on the own-race bias.”
AI output: “Recent studies include Johnson et al. (2023), who found that ORB is eliminated with extensive training…”
Problem: Johnson et al. (2023) may not exist, or may not have studied ORB at all. Never cite a paper you have not read.
Section 4: Method
Purpose
The Method section has one goal: enable replication. Another researcher should be able to read your Method and conduct the same study with the same procedures.
Structure
The Method typically includes 3-5 subsections:
- Design and Setting
- Participants
- Materials (or Measures)
- Procedure
- Data Analysis
4.1 Participants
What to Include
- Sample size (N)
- Demographics: Age (M, SD, range), gender distribution, race/ethnicity (if relevant), language
- Recruitment method: How and where participants were recruited
- Inclusion/exclusion criteria: Were any participants excluded? Why?
- Informed consent: Briefly state that participants provided informed consent
Example
NoteExample: Participants Section
Participants
Eighty undergraduate students (N = 80; 52 women, 28 men) were recruited from the University of Cape Town’s PSY3009F participant pool. Participants ranged in age from 18 to 24 years (M = 20.3, SD = 1.5). The sample included 42 Black South African participants and 38 White South African participants. Participants self-identified their race during the demographic questionnaire. All participants had normal or corrected-to-normal vision and provided informed consent in accordance with the UCT Research Ethics Committee (approval number: PSY2026-012). Participants received course credit for their participation.
Common Mistakes
❌ Too vague: “We recruited 80 participants.” (How? From where? What were their demographics?)
❌ Missing exclusions: If you excluded participants (e.g., due to incomplete data), you must report this. Otherwise, readers may think you are selectively reporting data.
✅ Solution: Report all exclusions transparently. Example: “Two additional participants were excluded due to incomplete data (>20% missing responses), resulting in a final sample of N = 80.”
4.2 Materials (or Measures)
What to Include
- Description of all measures: Questionnaires, tasks, stimuli
- Psychometric properties: If using an established scale, report reliability (e.g., Cronbach’s α) and cite the original source
- Stimulus details: For experimental tasks, describe the stimuli (e.g., number, type, how they were selected)
- Equipment: If relevant, describe software (e.g., Redcap), hardware (e.g., eye-tracker)
Example
NoteExample: Materials Section
Materials
Face Stimuli. The face recognition task used 120 face photographs (60 Black faces, 60 White faces) selected from the Chicago Face Database (Ma, Correll, & Wittenbrink, 2015). All faces were standardised for size, lighting, and background. Faces were cropped to remove hair and clothing cues, showing only the internal facial features. Each face was displayed in colour on a grey background. Faces were selected to be neutral in expression and matched across race for attractiveness ratings (based on normed data from the Chicago Face Database).
Recognition Task. The recognition task was programmed in PsychoPy (Peirce, 2007) and presented on a 15-inch laptop screen. During the study phase, participants viewed 60 faces (30 Black, 30 White) for 3 seconds each, with a 1-second inter-stimulus interval. Participants were instructed to try to remember each face. During the test phase, participants viewed 120 faces (60 old, 60 new) in randomised order and indicated whether each face was “old” (seen before) or “new” (not seen before) by pressing designated keys.
Demographic Questionnaire. Participants completed a brief demographic questionnaire that assessed age, gender, race, and language background.
AI Transparency
If you used AI tools to generate or modify materials, you must disclose this in the Method and on the plagiarism declaration.
ImportantExample AI Disclosure
“Stimulus words were generated with the assistance of ChatGPT (OpenAI, 2024) using the prompt: ‘Generate 50 emotionally neutral nouns between 4-6 letters.’ All generated words were verified for emotional neutrality using the ANEW database (Bradley & Lang, 1999).”
4.3 Procedure
What to Include
- Step-by-step description of what participants did, in chronological order
- Instructions given to participants (paraphrase or provide verbatim if critical)
- Duration of each phase
- Randomisation or counterbalancing (if applicable)
Example
NoteExample: Procedure Section
Procedure
The study was conducted individually in a quiet lab room. After providing informed consent, participants completed the demographic questionnaire. Next, participants completed the face recognition task. The study phase began with on-screen instructions: “You will see a series of faces. Please try to remember each face.” Participants then viewed 60 faces (30 Black, 30 White) in randomised order for 3 seconds each. After a 5-minute distractor task (participants completed a word-search puzzle), the test phase began. Participants were shown 120 faces (60 old, 60 new) in randomised order and indicated whether each face was “old” or “new” by pressing the “O” or “N” key. Faces remained on screen until a response was made. The entire procedure took approximately 30 minutes. Upon completion, participants were debriefed and thanked for their participation.
Common Mistakes
❌ Too vague: “Participants did a face recognition task.” (What exactly did they do?)
❌ Missing critical details: Did participants know there would be a memory test? Were faces randomised? How long did each phase take?
✅ Solution: Write the Procedure as if someone who has never done the study needs to replicate it exactly.
4.4 Data Analysis (Optional)
Some journals now recommend including a Data Analysis subsection that describes:
- How data were cleaned (exclusions, outliers)
- Which variables were calculated (e.g., d’, reaction time)
- Which statistical tests were planned
Example
NoteExample: Data Analysis Section
Data Analysis
Recognition sensitivity (d’) was calculated for each participant for both own-race and other-race faces using signal detection theory. Hits were defined as correctly identifying an old face as “old,” and false alarms were defined as incorrectly identifying a new face as “old.” d’ values were calculated as: d’ = Z(hit rate) − Z(false alarm rate). A 2 (Participant Race: Black, White) × 2 (Face Race: Black, White) mixed ANOVA was conducted, with Participant Race as a between-subjects factor and Face Race as a within-subjects factor. Alpha was set at .05. Effect sizes were calculated as partial eta-squared (\(\eta_p^2\)). All analyses were conducted in R (Version 4.3.0) using the afex package for ANOVA.
Section 5: Results
Purpose
The Results section reports findings objectively without interpretation. You present:
- Descriptive statistics (means, SDs, visualisations)
- Inferential statistics (tests, p-values, effect sizes)
Do not interpret or explain why results occurred (save that for the Discussion).
Structure
Step 1: Data Screening
Briefly report any exclusions, outliers, or data issues.
NoteExample
Data Screening
All participants completed the study with no missing data. Examination of histograms and Q-Q plots indicated that d’ scores were approximately normally distributed for all conditions. No outliers (>3 SD from the mean) were detected. Therefore, all 80 participants were retained for analysis.
Step 2: Descriptive Statistics
Report means and standard deviations for all conditions. Use a table or figure if you have multiple conditions.
Example: Descriptive Statistics in Text
NoteExample
Descriptive Statistics
Mean recognition sensitivity (d’) by Participant Race and Face Race is presented in Table 1. Overall, participants showed higher d’ for own-race faces (M = 1.81, SD = 0.48) compared to other-race faces (M = 1.27, SD = 0.40).
Example: Descriptive Statistics in a Table
Table 1 Mean Recognition Sensitivity (d’) by Participant Race and Face Race
| Participant Race | Face Race | M | SD | n |
|---|---|---|---|---|
| Black | Black (own-race) | 1.82 | 0.45 | 42 |
| Black | White (other-race) | 1.23 | 0.38 | 42 |
| White | White (own-race) | 1.79 | 0.52 | 38 |
| White | Black (other-race) | 1.31 | 0.41 | 38 |
Step 3: Inferential Statistics
Report the statistical test, test statistic, degrees of freedom, p-value, and effect size.
APA Format for Reporting Statistics
General template:
[Test], test statistic = [value], p [= or <] [value], [effect size] = [value]
Examples:
- t-test: t(78) = 3.45, p = .001, d = 0.78
- ANOVA: F(1, 78) = 12.34, p < .001, \(\eta_p^2\) = .14
- Chi-square: \(\chi^2\)(2, N = 80) = 8.23, p = .016, Cramér’s V = .32
- Correlation: r(78) = .45, p < .001
NoteExample Inferential Statistics Paragraph
Inferential Statistics
A 2 (Participant Race: Black, White) × 2 (Face Race: Black, White) mixed ANOVA was conducted on d’ scores. The main effect of Face Race was significant, F(1, 78) = 45.67, p < .001, \(\eta_p^2\) = .37, indicating that participants had higher recognition sensitivity for own-race faces (M = 1.81, SD = 0.48) compared to other-race faces (M = 1.27, SD = 0.40). The main effect of Participant Race was not significant, F(1, 78) = 0.23, p = .632, \(\eta_p^2\) < .01, indicating that Black and White participants did not differ in overall recognition sensitivity. Critically, the interaction between Participant Race and Face Race was significant, F(1, 78) = 15.23, p < .001, \(\eta_p^2\) = .16, confirming that the own-race bias occurred for both Black and White participants. Follow-up paired t-tests confirmed that Black participants showed higher d’ for Black faces compared to White faces, t(41) = 6.12, p < .001, d = 1.41, and White participants showed higher d’ for White faces compared to Black faces, t(37) = 4.89, p < .001, d = 1.03.
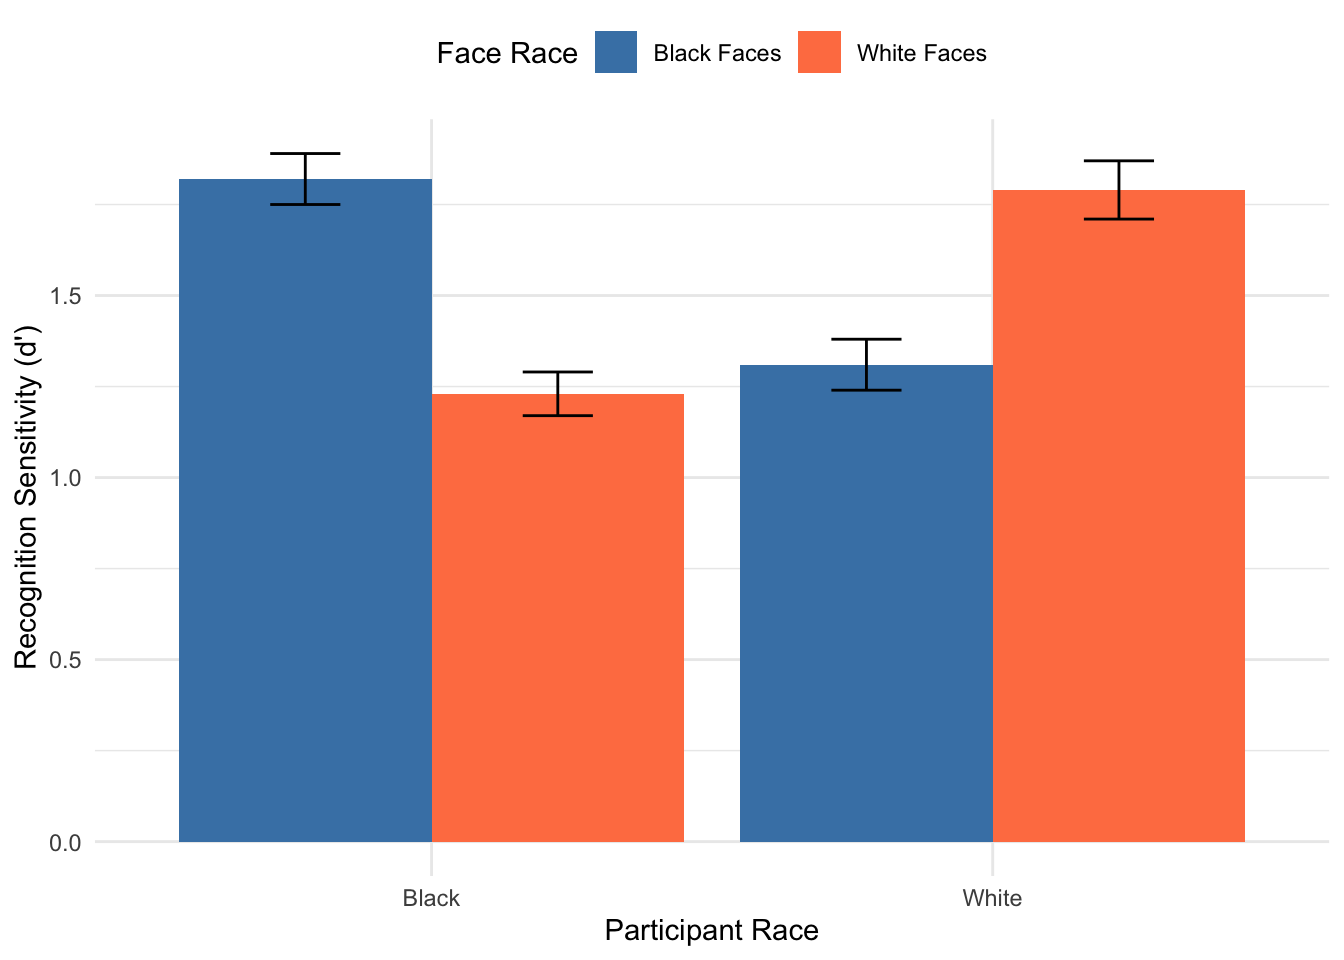
Step 4: Figures
Include figures to visualise key findings. All figures must be:
- Numbered (e.g., Figure 1, Figure 2)
- Titled (descriptive caption below the figure)
- Cited in text (e.g., “as shown in Figure 1”)
Example Figure
Common Mistakes in Results
❌ Interpreting findings: “The results show that participants remembered own-race faces better because they have more experience with them.” (Save interpretation for Discussion)
❌ Missing effect sizes: Report Cohen’s d, \(\eta_p^2\), or \(\omega^2\) for all tests.
❌ Inconsistent rounding: Use consistent decimal places (typically 2 for M and SD, 3 for p-values and effect sizes).
❌ Reporting p = .000: SPSS sometimes outputs this. Report as p < .001 instead.
✅ Solution: Results should be purely descriptive. Report all key statistics. Use consistent formatting.
Section 6: Discussion
Purpose
The Discussion interprets your findings and situates them within the broader literature. It answers:
- What did you find? (Brief summary)
- What does it mean? (Interpretation in light of theory)
- How do your findings fit with previous research? (Synthesis)
- What are the limitations? (Honest critique)
- What are the implications and future directions? (Broader impact)
Structure
Paragraph 1: Summary of Findings
Start with a brief, plain-language summary of your key results (1-2 sentences).
NoteExample Opening
The current study investigated whether South African university students demonstrate the own-race bias (ORB) in face recognition. Consistent with our hypothesis, both Black and White participants showed significantly higher recognition sensitivity (d’) for own-race faces compared to other-race faces, with a medium-sized interaction effect.
Paragraphs 2-4: Interpretation and Integration with Literature
Interpret your findings and relate them to the theories and studies you discussed in the Introduction.
NoteExample Interpretation Paragraph
These findings support the perceptual expertise hypothesis of ORB (Meissner & Brigham, 2001), which proposes that people develop greater expertise for processing faces of their own race due to more frequent exposure. Both Black and White participants showed higher d’ for own-race faces, suggesting that perceptual expertise develops regardless of race. Importantly, this finding occurred in a diverse South African sample, where participants are likely to have had substantial exposure to faces of multiple races. This suggests that mere exposure is not sufficient to eliminate ORB; instead, the development of perceptual expertise may require more active, individualised processing of other-race faces (Tanaka, Kiefer, & Bukach, 2004).
Why this works:
- ✅ Links findings to theory (perceptual expertise hypothesis)
- ✅ Cites relevant studies
- ✅ Explains what the findings mean in context (exposure alone is not enough)
Paragraphs 5-6: Limitations
Be honest but not self-defeating. Identify limitations, but do not undermine the entire study.
NoteExample Limitations Paragraph
Several limitations should be noted. First, our sample consisted entirely of university students, who may not be representative of the broader South African population. University students are likely to have higher levels of interracial contact than the general population, which may have reduced the magnitude of ORB. Future research should examine ORB in more diverse community samples. Second, our study used standardised face photographs from the Chicago Face Database, which may not fully represent the variability of faces encountered in everyday life. Future research could use more ecologically valid stimuli, such as video recordings or faces with varied expressions and lighting conditions. Third, we used a simple old/new recognition task, which may not capture the complexity of real-world face recognition (e.g., identifying a person across different contexts). Future research could use more applied measures, such as simulated lineup tasks.
Good limitations to discuss:
- Sample characteristics (size, demographics, representativeness)
- Ecological validity (lab vs. real-world)
- Measurement issues (reliability, validity)
- Design limitations (correlational vs. experimental, confounds)
Avoid:
- ❌ “We had a small sample size” (unless it actually is problematically small, e.g., n < 20)
- ❌ “Future research should…” without explaining why that direction is important
Final Paragraph: Implications and Conclusion
End with the broader significance of your findings.
NoteExample Conclusion
In conclusion, this study provides evidence that ORB is a robust phenomenon that occurs in both Black and White South African university students, despite high levels of interracial contact. These findings have important implications for applied contexts, such as eyewitness identification, where cross-race identifications are common and prone to error. Training programmes aimed at improving other-race face recognition should focus on enhancing individualised processing of other-race faces, rather than simply increasing exposure. Future research should examine the cognitive and neural mechanisms underlying ORB in diverse populations to inform evidence-based interventions.
Common Mistakes in Discussion
❌ Overstating findings: “This study proves that ORB is caused by perceptual expertise.” (You cannot “prove” anything with one study; use “supports” or “suggests”)
❌ Ignoring non-significant findings: If you hypothesised an effect that was not significant, you must discuss it.
❌ Introducing new literature: Do not cite studies in the Discussion that were not mentioned in the Introduction. (Exception: You can cite new studies to explain unexpected findings.)
❌ Ending weakly: Do not end with “More research is needed.” End with a strong statement about the significance of your findings.
Section 7: References
APA 7th Edition Format
All references must be formatted in APA 7th edition style. Key rules:
- Alphabetical order by first author’s surname
- Hanging indent (first line flush left, subsequent lines indented)
- DOI or URL for all online sources
Common Reference Types
Journal Article
Format: Author, A. A., Author, B. B., & Author, C. C. (Year). Title of article. Title of Journal, volume(issue), pages. https://doi.org/xxxxx
Example: Meissner, C. A., & Brigham, J. C. (2001). Thirty years of investigating the own-race bias in memory for faces: A meta-analytic review. Psychology, Public Policy, and Law, 7(1), 3-35. https://doi.org/10.1037/1076-8971.7.1.3
Book
Format: Author, A. A. (Year). Title of book (Edition). Publisher.
Example: Groome, D., & Eysenck, M. (2016). An introduction to applied cognitive psychology. Psychology Press.
Chapter in Edited Book
Format: Author, A. A., & Author, B. B. (Year). Title of chapter. In E. E. Editor & F. F. Editor (Eds.), Title of book (pp. pages). Publisher.
Example: Tanaka, J. W., & Pierce, L. J. (2009). The neural plasticity of other-race face recognition. In G. Rhodes & N. Kanwisher (Eds.), Progress in brain research (Vol. 164, pp. 179-190). Elsevier.
AI Tool
Format: Company. (Year). Name of tool (Version) [Large language model]. URL
Example: OpenAI. (2024). ChatGPT (GPT-4 version, May 2024) [Large language model]. https://chat.openai.com
When to cite AI: If you used AI for substantive help (e.g., generating stimuli, suggesting analyses, improving writing), cite it in-text and in the reference list. Describe the use in the Method section and on the plagiarism declaration.
ImportantHow to Cite AI in Text
- “Stimulus words were generated with assistance from ChatGPT (OpenAI, 2024).”
- “Data cleaning code was developed with assistance from Claude (Anthropic, 2026).”
Using Zotero for References
Do not format references manually. Use a reference manager like Zotero (see the “Conducting Your Research Project” guide for setup instructions).
Quarto Integration
If you are writing your report in Quarto (recommended), use a .bib file:
- Export your Zotero library as
references.bib - In your
.qmdfile header, add:
bibliography: references.bib
csl: apa.csl- Cite in text using
[@AuthorYear]syntax, e.g.,[@Meissner2001] - Quarto will automatically generate the reference list in APA format
Writing Style and Clarity
General Principles
- Use active voice (when appropriate)
- ❌ Passive: “The experiment was conducted by the researchers.”
- ✅ Active: “We conducted the experiment.”
- Be concise
- ❌ Wordy: “It is important to note that the results demonstrated that…”
- ✅ Concise: “The results showed that…”
- Avoid jargon (unless necessary and defined)
- ❌ “We employed a 2×2 between-within factorial design with the DV operationalised as d-prime.”
- ✅ “We used a mixed design with two factors: Participant Race (between-subjects) and Face Race (within-subjects). The dependent variable was recognition sensitivity (d’).”
- Use past tense for what you did (Method, Results) and present tense for general statements
- ✅ “Participants completed the task” (past tense – you did this)
- ✅ “Research shows that memory declines with age” (present tense – general fact)
Common Grammar and Style Errors
“This” without a referent
❌ “Participants showed higher accuracy for emotional words. This is consistent with previous research.” (What is “this”? The finding? The pattern? Be specific.)
✅ “Participants showed higher accuracy for emotional words. This finding is consistent with previous research.”
Overuse of “significant”
In scientific writing, “significant” has a specific meaning (p < .05). Avoid using it colloquially.
❌ “There was a significant difference in age between groups, but this was not significant.”
✅ “There was a statistically significant difference in age between groups, but this difference was not practically meaningful.”
Confusing “affect” and “effect”
- Affect = verb (to influence)
- Effect = noun (the result)
❌ “Emotion had a significant affect on memory.” ✅ “Emotion had a significant effect on memory.” ✅ “Emotion significantly affected memory.”
Using AI to Improve Your Writing
AI can be a powerful tool for improving clarity, grammar, and structure – if used ethically.
✅ Ethical Uses of AI for Writing
Grammar and Clarity Checking
Prompt: “Improve the clarity and grammar of this paragraph while keeping the meaning unchanged: [paste paragraph]”
AI can help you:
- Fix grammatical errors
- Simplify overly complex sentences
- Convert passive voice to active voice
Important: You must understand and approve every change. Do not blindly accept AI suggestions.
Restructuring Sentences
Prompt: “Suggest a clearer way to phrase this sentence: [paste sentence]”
Identifying Weaknesses
Prompt: “Read this paragraph and identify any logical gaps, unclear statements, or missing transitions: [paste paragraph]”
Checking Flow
Prompt: “Does this Introduction flow logically from general to specific? Are there any abrupt transitions?”
❌ Unethical Uses of AI for Writing
Asking AI to Write Sections
❌ “Write an Introduction about the own-race bias in face recognition.”
Why this is wrong: Even if you edit the output, the intellectual work (synthesis, argumentation) was done by the AI, not by you. This is plagiarism.
Paraphrasing Sources with AI
❌ “Paraphrase this paragraph from Smith (2020): [paste text]”
Why this is wrong: You are still using someone else’s ideas without doing the intellectual work of understanding and reformulating them yourself.
Using AI to Generate “Original” Ideas
❌ “Generate three novel hypotheses about face recognition.”
Why this is wrong: The ideas are not yours, and you have not engaged with the literature to understand why these hypotheses matter.
How to Disclose AI Use
If you used AI for any part of your writing, disclose it in the Method section and on the plagiarism declaration:
NoteExample AI Disclosure
“We used ChatGPT (OpenAI, 2024) to check grammar and improve sentence clarity in the Introduction and Discussion sections. All substantive content and arguments were developed by the authors.”
Final Checklist Before Submission
Print this checklist and go through it before submitting your report.
Content Checklist
APA Style Checklist
Formatting Checklist
Ethics Checklist
Technical Checklist
Conclusion
Writing a research report is a skill that develops with practice. Use this guide as a reference throughout the writing process, and do not hesitate to ask your tutor or course convener for feedback. Remember:
- Clarity is paramount: Your ideas are only as good as your ability to communicate them
- Honesty is essential: Report all findings (including negative results) and limitations
- Citations are mandatory: Give credit to the researchers whose work you build upon
- AI is a tool, not a substitute: Use AI to enhance your writing, not to replace your thinking
Good luck with your research report!
Additional Resources
APA Style Resources
- Official APA Style Website: https://apastyle.apa.org
- Purdue OWL APA Guide: https://owl.purdue.edu/owl/research_and_citation/apa_style/apa_style_introduction.html
- APA 7th Edition Sample Papers: https://apastyle.apa.org/style-grammar-guidelines/paper-format/sample-papers
Writing Resources
- UCT Writing Centre: Book a consultation via the Centre for Higher Education Development (CHED)
- Grammarly: https://www.grammarly.com (free grammar checker)
- Hemingway Editor: http://www.hemingwayapp.com (checks readability)
Statistical Reporting
- Reporting Statistics in APA Style: https://apastyle.apa.org/instructional-aids/numbers-statistics-guide.pdf
- Effect Size Calculator: https://www.psychometrica.de/effect_size.html
Reference Management
- Zotero: https://www.zotero.org
- Better BibTeX for Zotero: https://retorque.re/zotero-better-bibtex/ (for Quarto users)
- Zotero Documentation: https://www.zotero.org/support/